Introductory Calculus: Marginal Analysis
By M Ransom
- To understand this process, we look first at an example function
 What is the rate of change of
  at
at  ?
?
We calculate the derivative and then substitute 1 for x:
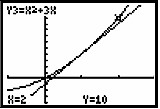
Graphs illustrating this process are shown below. The tangent line atis
We have
as an equation of the tangent line. Examine the points on the graph and on the tangent where
. They are not far apart. The tangent line gives an estimate of the actual point on the original function
The actual function value on the graph is 10. The tangent line estimates this at 9. This estimate is better the closer we are to the point of tangency, in this case the point where
. This estimate is helpful for more complicated functions in arriving quickly at a value which is “close” to the next value of the function.
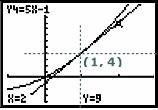
Notice that the point on both the graphs of
and the tangent line at
is (1, 4). The slope, or derivative of
, of the tangent line is 5 at that point as we calculated above. This means the function increased about 5 units from the point where
to the point where
. We use this derivative in marginal analysis.
Let’s Practice:Marginal profit is the derivative of the profit function (the same is true for cost and revenue). We use this marginal profit function to estimate the amount of profit from the “next” item.For example: using our profit function from test #1, we have
Therefore, The marginal profit at
is
P'(300) = 80 + 0.2(300) - (40 + 0.4(300)) = -$20Using the ideas from the example above, we know that -20 represents an estimate of the change in profit from the points on the profit graph atand
. An estimate of the profit from the 301st item is -20.
It is important to be able to compare this to the exact change in profit as we move to the 301st item. Remember that the derivative gives us a point on the tangent line, which is not exactly on the actual graph of the profit function.The exact profit from the 301st item is given byP(301) - P(300) = 1000 = -$20.10
We can see that this estimate of -$20 from the derivative ofis very close to the exact value.
Summary:
An estimate of the amount of profit from the 301st item (the change in profit as we go from 300 items to 301 items) is given byP'(300) = -20
The exact change in profit is given byP(301) - P(300) = -$20.10
A company has a fixed cost of $4000 and a variable cost of 
What is the total cost function and what is the marginal cost when x = 500?
Explain what the marginal cost means.
DVD players cost $80 apiece. What is the revenue function?
The company that manufactures these DVD’s has a cost function

What is the profit function?
What is the marginal profit at x = 1000? Explain what this means.
Use the marginal cost to estimate the cost of producing the 51st item if a company’s cost for producing x items per day is given by

Calculate the exact cost of producing the 51st item and compare answers.