EXCEL Modeling: Linear Functions
By C Colwell, B Richey
Often while studying linear functions it is useful to model how the graphs of these functions change as their slope (m) and y-intercepts (b) are modified.
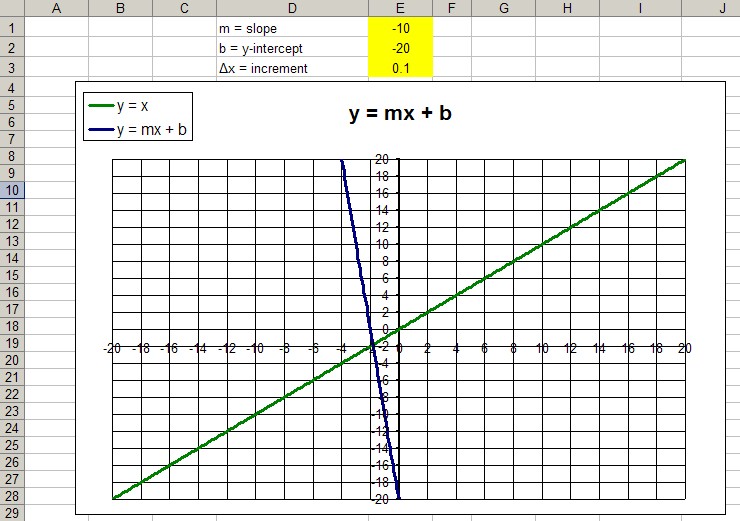
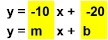
The first EXCEL sheet shown above can be modified manually by entering values into the highlighted yellow column. Those changes are automatically updated on the blue graph and reflected in the rebuilt equation shown below. This spreadsheet's operation does not require the enabling of macros.
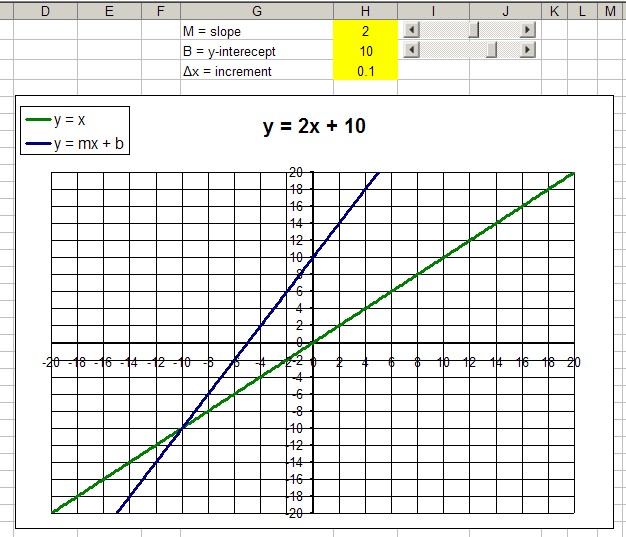
To run the second EXCEL sheet you have to enable the use of macros to operate the sliders. The range for each slider has been optimized for supporting the spreadsheet's programming.
Information about graphing linear value functions can be found in the following lessons: