Introductory Calculus: Second Derivative Test
By M Ransom
We look first at an example function. We calculate the derivative:
Notice that the derivative equals 0 when x = -1 or +1.It can be shown that the derivative is positive when x < -1 and x > +1, and is negative when -1 < x < +1.Next we calculate the second derivative:.
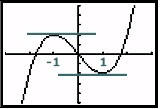
Notice that the second derivative is 0 when x = 0.It can be shown that the second derivative is negative for x < 0 and positive for x > 0.Below, we show the graph oftwice. In the second graph, tangent lines are drawn which are horizontal (reminder: lines which are horizontal have a slope of 0). Some observations about these diagrams are made below the graphs.
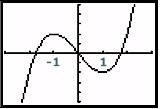
appears to be “curving downward” until x = 0.
appears to be “curving upward” from x = 0 onward.
has a relative maximum at (-1, 2) where
is “curving downward” and a minimum at (1, -2) where
is “curving upward.”
changes from concave down to concave up at the point (0, 0) and the second derivative is 0.
These observations can be summarized as follows:
is concave down when x < 0
(notice the second derivative is negative).is concave up when 0 < x
(notice the second derivative is positive).has a relative maximum at (-1, 2) and
.
has a relative minimum at (1, -2) and
.
Use the following information aboutto answer the next three questions:

Put the information about the first and second derivatives into sign charts.
Sketch a possible graph of  paying close attention to the points given, the regions of increase and decrease, and the regions of differing concavity.
paying close attention to the points given, the regions of increase and decrease, and the regions of differing concavity.
At what value(s) of  is there a relative min or max? How do you know?
Use the following information aboutto answer the next two questions.
Find the critical points of  from the first derivative. Use these to construct a sign chart for
  .
.
from the first derivative. Use these to construct a sign chart for 
Find the critical points of  from the second derivative. Use these to construct a sign chart for
  .
.
from the second derivative. Use these to construct a sign chart for