Algebra II Recipe: Correlations and Best-Fitting Lines
By C Adams
Directions and/or Common Information:
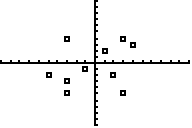
Describe the relationship between the x and y coordinates.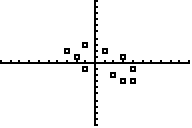
(-3, -2) (-2, -2) (-1, -2) (-1, -1) (0, 0) (1, 1) (2, 1) (2, 2) (3, 3)
(-3, 2) (-2, 1) (-1, 0) (-1, 1) (0, 1) (1, 0) (1, -1) (2, -2) (3, -1) (3, -2)
Directions and/or Common Information:
Choose the best answer for each question.If a graph has positive correlation, the graph could be best described as:
If a graph has negative correlation, that means:
What is the approximate slope for the line that best fits the following data points:
(6, 11) (8, 10) (9, 11) (9, 10) (10, 10) (10, 9) (12, 9) (12, 8) (14, 7)
Using the 2004 Hurricane Data below, what would be the best explanation for the slope of the line of best fit?
Storm Name | Barometric Pressure | Wind Speed |
Hurricane Alex | 957 | 120 |
Tropical Storm Bonnie | 1000 | 65 |
Hurricane Charley | 941 | 145 |
Hurricane Danielle | 970 | 105 |
Tropical Storm Earl | 1005 | 45 |
Hurricane Frances | 935 | 145 |
Tropical Storm Gaston | 991 | 70 |
Tropical Storm Hermine | 1000 | 50 |
Hurricane Ivan | 910 | 165 |
Tropical Depression Ten | 1013 | 35 |
Hurricane Jeane | 950 | 115 |
Hurricane Karl | 938 | 140 |
Hurricane Lisa | 987 | 75 |
Tropical Storm Matthew | 997 | 45 |
Tropical Storm Nicole | 988 | 50 |
Tropical Storm Otto | 993 | 50 |
Review the related Study Aid
Advertisement