Algebra I Recipe: Fitting a Line to Data
By S Bay
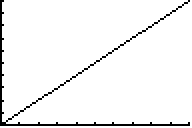
Given the graph below, describe the correlation.
Given the following, what is the relationship between the data?
(1, 2) (2, 3) (2, 4) (3, 5) (3, 4) (5, 6) (5, 7) (6, 8) (7, 9)
If a graph has a positive correlation, the graph could best be described as
If a graph has a negative correlation, that means
What is the approximate slope of the best fit line for the following data:
(14, 7) (12, 8) (12, 9) (10, 9) (10, 10) (9, 10) (9, 11) (8, 10) (6, 11)
What is the equation of the best fit line for the following data:
Years of Experience | Salary (in thousands) |
0 | 27.5 |
1 | 28.0 |
2 | 28.5 |
3 | 29.0 |
4 | 29.5 |
5 | 30.0 |
6 | 30.5 |
7 | 31.0 |
Review the related Study Aid
Advertisement