Biology Graphs: Survivorship Curves
By L Chapman
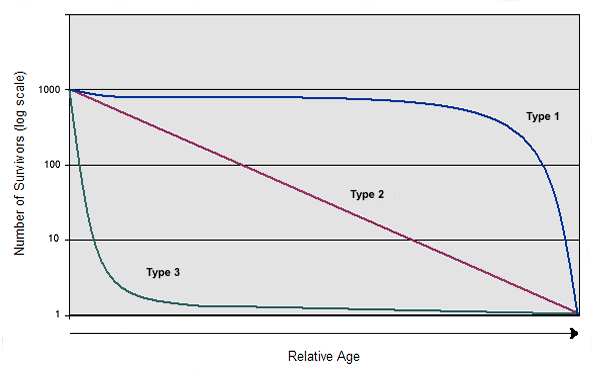
Survivorship curves fit three types. A Type I curve shows a low death rate in early and middle life but the death rate increases steeply in old age. A Type II curve shows a death rate is more constant throughout the lifetime of the species. Type III curve shows high early death rates but the death rate slows for those individuals who have survived the early stage.
Which curve would fit an organism that cares for its young and reproduces relatively late in life?
Which curve would be typical of an organism that experiences high predation as small individuals but when they are adults are more able to avoid most predators?
Which curve might best fit rodents that die in numbers at all ages?