Biology Graphs: Population Graphing
By L Chapman
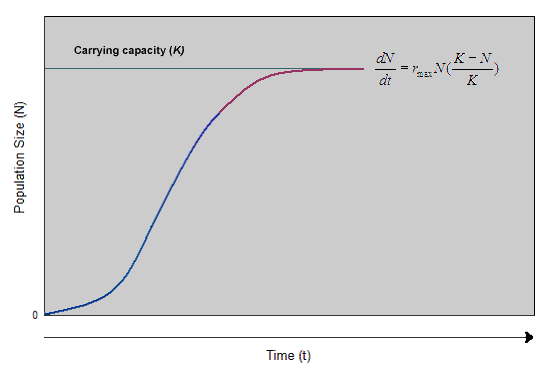
Populations that grow rapidly unchecked can grow explosively. Under ideal conditions, without restrictions, populations begin growing slowly but as time pass the growth rate rapidly increases.
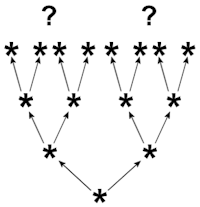
In the star graph what numbers would be found in the generation after the 8?
How can we use the star graph to predict further generation numbers?
Why does knowing the function for Population Size vs Time make it easier to make future predictions?
How does the K (carrying capacity) affect the size of a population?
What might a more realistic graph look like around K?
Extension:
Which allowance would you choose: 1 penny growing exponentially or 1?